The phrase “the housing market” suggests a single place where a price is struck, the way a commodity exchange strikes a price for wheat. Nothing of the sort exists. What actually happens in a town or a district is a slow succession of private negotiations: a few hundred a year in a small area, perhaps a few thousand in a large one, each between two households with different reasons for moving and different amounts of time to do it in. Every one of those negotiations is settled separately, in private, weeks or months after the figures were agreed. The published number that appears afterwards is a summary of those settlements, not an instruction to them.
Three features follow from that structure, and almost every confusing thing about housing follows from those three.
Every unit is different, so there is no single price
Two houses on the same street, built to the same plan in the same year, can be worth noticeably different amounts. One has a rear extension, a repaired roof and a south-facing garden; the other has a shared drive, a boiler at the end of its life and a bedroom that was divided into two small ones. Neither is right or wrong. They are simply different objects, and the market has no mechanism for declaring an official rate per square metre that both must obey. What it produces instead is a cloud of settlements, each explicable but none authoritative.
This is why an average price for an area can move without any individual house changing in value. If a run of larger properties happens to sell in one quarter, the average rises. If the same number of flats sells the next quarter, it falls. Neither movement tells you anything about the house you live in. The useful comparison is always between similar properties in similar condition, and even then it is a comparison of what two particular sets of people agreed, not of what the houses were worth in the abstract.
Transactions are slow, and slowness is a price in itself
Buying a home takes months. In that time a buyer arranges finance, a solicitor checks the title, a surveyor inspects the fabric, and both parties remain free to change their minds in most jurisdictions until a binding point late in the process. That delay is not administrative clutter; it is the market working. It is the interval in which the two sides find out whether the thing being sold is the thing they thought it was.
The consequence is that time has a value in every negotiation. A seller who must move by a fixed date will accept less than one who can wait a year. A buyer who has already sold, has finance agreed and no chain beneath them is worth more to a seller than a buyer offering slightly more money but requiring six months and three other transactions to line up. When people say a house “sold under the asking price”, they very often mean it sold to the party who could complete.
Most owners are not participating at any given moment
In a typical year only a small fraction of homes in any area change hands. The overwhelming majority of owners are doing nothing at all: not selling, not buying, not responding to anything the market is doing. This is the single most underrated fact about housing. In an exchange, supply is whatever holders are willing to release at the current price, and it responds quickly. In housing, supply is whatever a small number of households happen to be moving for reasons mostly unconnected to price — a new job, a birth, a separation, a death, a retirement, a school — and it responds slowly and awkwardly.
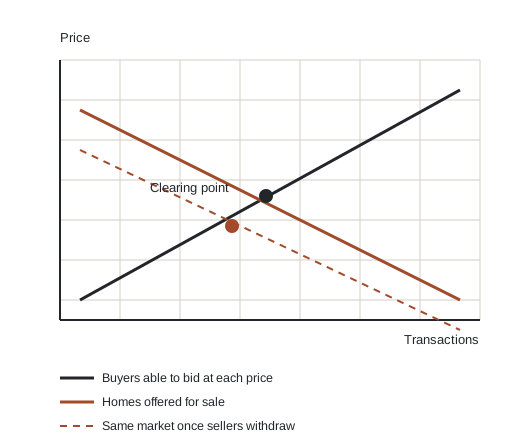
Because supply is inelastic in this way, the first thing that gives when conditions change is usually not price but volume. In a weakening market, sellers who do not have to move take their homes off the market and wait; the number of transactions falls sharply while headline prices barely move for a year or more. In a strengthening market, the same reluctance means it takes a long time for extra supply to appear, so competition concentrates on the few homes actually available. Sales volume, not price, is the early indicator of almost every turn.
What the local market is actually made of
It is worth being concrete about the parts. A local market at any moment consists of: the stock of homes that exist and their condition; the number of households forming, dissolving and changing size; the cost and availability of borrowing; the amount of equity existing owners already hold; the friction of moving, which includes transaction taxes, professional fees, removal costs and the sheer effort of it; and the pipeline of new building, which in most places adds well under one per cent to the stock in a year.
Notice how few of those are things anyone can observe on a given Tuesday. The visible layer — asking prices, the number of boards on a street, how busy viewings are — sits on top of a much slower set of forces. That mismatch between what is visible and what is decisive is the reason housing commentary is so often wrong in the short run and so often obvious in retrospect.
How to read a local market without a crystal ball
A few habits make the picture clearer. Watch transaction counts rather than average prices, because volume turns first. Compare asking prices with what similar homes actually completed at, since the gap between the two is the clearest signal of which way the balance has tipped. Look at how long homes are on the market before they go under offer, and at how many reduce their asking price rather than sell. And separate the market for family houses from the market for one and two-bedroom flats: in most places these behave like two different markets that happen to share a postcode, because they serve households at different stages with different constraints.
None of this yields a forecast, and this site does not offer one. It yields something more useful: an understanding of why the numbers move the way they do, and why the answer to “what is this worth?” is always “to whom, and by when?”